![]()


GRDC Functional Genomics Program: "Growth and End-use Quality of Cereals"
1 Department of Plant Science, University of Adelaide Waite Campus, Glen Osmond SA 5064
2 Plant Cell Biology Research Centre, School of Botany, The University of Melbourne, VIC 3010
Abstract
Genes involved in cell wall metabolism can be studied by analysing gene expression in etiolated barley coleoptiles. Although the coleoptile is a unique tissue that undergoes elongation with no cell division, its cell wall metabolism is similar to others parts of the plant, only compressed in time and simplicity. The growth of coleoptiles can be well defined temporally and chemically, providing a good opportunity for the identification of genes involved in cell wall synthesis and modification.
Restriction Fragment Differential Display (RFDD) is a simple, informative tool for the assessment of message diversity using cDNA. Analysis of coleoptile cDNA from early-, mid- and mature-growth phases showed that messages were at their most diverse one day after imbibition, whereas those from two and seven days were very similar. We expect the expression of genes that are key to cell elongation will be in cDNA populations with most diversity, one day after imbibition.
Introduction
The coleoptile is a convenient plant organ to study because of its short growth cycle, relatively simple tissue composition, and growth by cell elongation in the absence of cell division.
Because we are interested in discovering the genes and proteins involved in cell elongation, we wished to determine when the transcription of these genes was most likely to occur. To aide this determination we conducted estimates of relative growth rate using measurements of dry weight, length and total RNA. We then profiled gene expression using restriction fragment differential display PCR technology (RFDD-PCR) (Display Systems Biotech Inc).
RFDD is a similar process to the widely used mapping technique, AFLP (Vos et al., 1995). RFDD differs by using cDNA as a template so it can be used to fingerprint the RNA population from which the cDNA was derived.
These three measurements indicate that mRNA sequences, critical for cell wall biosynthesis, must be made during the early-growth phase. We have prepared cDNA populations from this early-growth phase and targeted sequences for comparison against current databases to determine a theoretical function.
Materials and Methods
Coleoptiles were imbibed in aereated water 24 h, then growth in saturated vermiculite at 20 °C in darkness.
The process chosen for assessment of RNA diversity is called Restriction Fragment Differential Display (RFDD). Total RNA was obtained by the Trizol method as described by the manufacturer (Gibco BRL). This material was used to produce a population of Taq1 digested and asymmetric adapter ligated cDNA fragments. A subset of this population was amplified by PCR with a primer extending three base pairs into the cDNA fragment (Expression window primer) at one end and a fluorescently tagged primer (O-Extension primer) not extending into the fragment at the other end. The fluorescently labeled products were analysed by PAGE analysis on an ABI 373XL DNA sequencer using Genescan software (Applied Biosystems). Expression windows showing differentially expressed cDNA fragments were isolated by re-amplifying the Expression window (total 100μl) with non fluorescent primers and separating the fragments by reverse phase HPLC (Wong et al., 2000). The isolated fractions containing fragments were dried and sequenced on an ABI 3700 DNA sequencer (Applied Biosystems Protocol)
Results and Discussion
The timing of gene expression is as relevant to the researcher studying plant growth as it is to the plant. Growth rate analysis indicates that the greatest relative change in biomass occurs very early in cell and tissue growth (Figures 1&2). Therefore it seems appropriate to explore growth relevant gene expression during the early phases of growth.
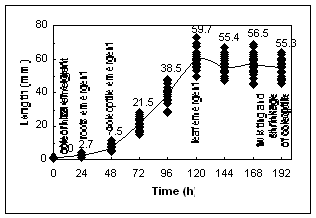
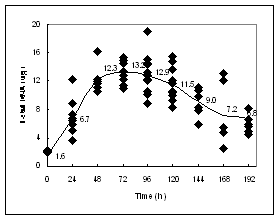
Figure1 A:Growth of etiolated coleoptiles. Data are for individual coleoptiles. Dry weight gain is similar to the pattern seen for coleoptile length. B: Total RNA content for individual coleoptiles, except at 0 d when ten individuals were pooled.
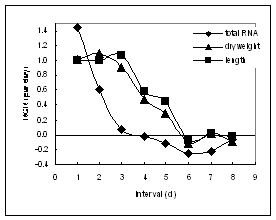
Figure 2: Relative growth rates as expressed by dry weight, length and total RNA content. The greatest relative rate of RNA synthesis precedes the greatest relative rate of growth.
RFDD templates from two preparations of RNA per time period were prepared for 0, 1, 2 and 7 d coleoptiles. RFDD fingerprints for one quarter of the 64 possible Expression windows has been analysed. Generally, fingerprints were similar for the same time point with the exception of those from 1 d. Fingerprints from 0, 2 and 7 d were quite similar to each other, containing relatively few fragments varying sometimes in intensity. Those fingerprints from 1 d were somewhat dissimilar to 0, 2 and 7 d as well as different from each other. They contained fragments that only appear in 1 d tissue. Expression window 10 is illustrated in Figure 3 and shows the relative similarity of 0, 2 and 7 d fingerprints and the divergence of the 1 d fingerprints.
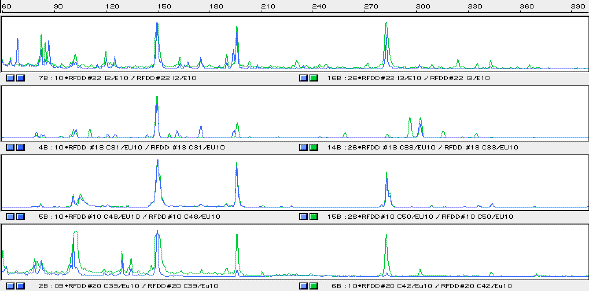
Figure3: Expression window 10 showing size in base pairs along the horizontal axis and fluorescent intensity (relative abundance) on the vertical axis.
Panel 1; RFDD fingerprint for cDNAs I2 and I3 prepared from 0 d coleoptiles.
Panel 2; RFDD fingerprint for cDNAs C31 and C33 prepared from1 d coleoptiles.
Panel 3; RFDD fingerprint for cDNAs C48 and C50 prepared from 2 d coleoptiles.
Panel 4; RFDD fingerprint for cDNAs C39 and C42 prepared from 7 d coleoptiles.
Some of the cDNA fragments that were differentially expressed in 1 d tissue have been isolated and sequenced. The Expression window containing the target fragment or fragments was re-amplified and separated by reverse phase HPLC. The retention time of a fragment has a logarithmic relationship to its size and size can be roughly estimated by comparison to a standard. An examination of Expression window 14 for the cDNA C31 (1 d) is shown in Figure 4 and an analysis of putative sequence identity appears on Table1.
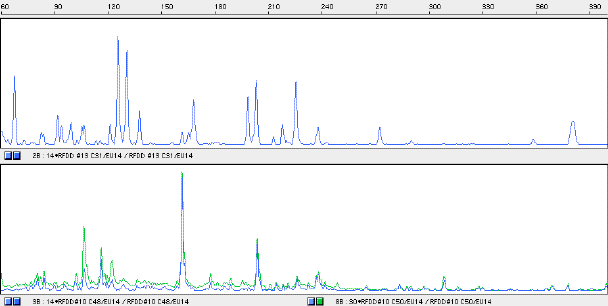
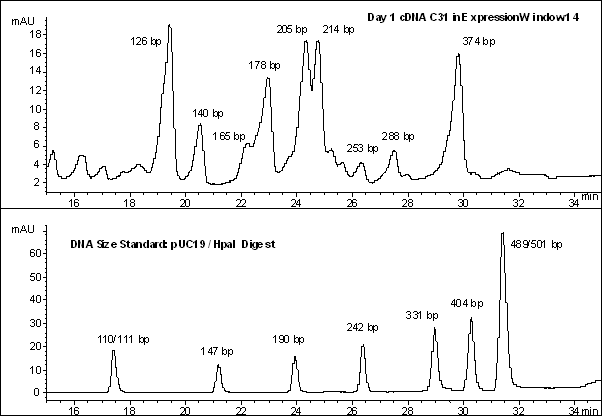
Figure4: Expression window 14 for the 1 d cDNA C31 and the day 2 cDNAs C48 and C50.
Panel 1; RFDD fingerprint for cDNA C31 for the Expression window 14 - size in base pairs along the horizontal axis and fluorescent intensity (relative abundance) on the vertical axis.
Panel 2; RFDD fingerprint for cDNAs C48 and C50 prepared from 2 d coleoptiles for the Expression window 14 - size in base pairs along the horizontal axis and fluorescent intensity (relative abundance) on the vertical axis.
Panel 3; HPLC chromatogram for the cDNA C31 indicating estimated sizes of fragments in base pairs (bp)
Panel 4; HPLC chromatogram for the Size Standard pUC19/HPA II digest (1μg) - sizes of fragments in base pairs (bp)
Estimated Size (bp) |
Actual Size (bp) |
Sequence Identity |
Barley Est match accession number |
126 |
123 |
Proline hydroxylase |
- |
140 |
136 |
Carboxypeptidase |
- |
178 |
176 |
Ribosomal sequence |
13323809 |
205 |
196 |
unknown |
- |
288 |
273 |
Phosphoglycerate kinase |
12035108 |
374 |
378 |
unknown |
- |
Table 1: Summary of some fragment sequences from the 1 d cDNA C31
Conclusions
The combination of three analyses shows that in coleoptile tissue, before the second day post imbibition, transcription is at its most diverse and as such is most likely to contain sequences associated with the dominant function of the tissue, cell wall biosynthesis.
Examination of RFDD fingerprints has yielded many differentially expressed fragments appearing only in cDNAs prepared from 1 d coleoptiles. Isolation and sequencing of some of these fragments has produced sequences strongly correlated with those of known or theoretical function and those that have no strong correlation.
The relatively high number of sequences obtained that have an unknown function and those that have no related barley or even cereal EST imply that 1 d coleoptile tissue is producing large numbers of normally rare transcripts. This fact leads us to hope that the approach may lead to the discovery of quite novel genes associated with cell wall biosynthesis.
Acknowledgements
I would like to express my thanks an appreciation for the help provided by Dr. Burton.
This work was funded by the Grains Research & Development Council, Australia.
References
1. The RFFD process was undertaken using the Display Profile kit manufactured by Display Systems Biotech, Inc 1010 Joshua Way, Vista, CA 92083 USA and distributed in Australia by Integrated Sciences, Level1, 2 McCabe Place, Willoughby NSW, 2068.
2. Vos, P., Hogers, R., Bleeker, M.,Reijans, M., vande Lee, T.,Hornes, M., Fritjers, A.,Pot,J., Peleman, J., Kuiper, M. And Zabeau, M., Nucleic Acids Res., 1995, 23:4407-4414
3. Gibco BRL, Rockville MD 20849-6482, USA manufacturers of Trizol Reagent; catalogue number15596-026
4. Genescan software is a product of Applied Biosystems, 850 Lincoln Centre drive, Foster City, Ca 94404-1128 USA
5. Wong, L.Y., Belonogoff,.V, Boyd, V.L., Hunkapillar, N.M., Casey, P.M., Liew, S.N., Lazaruk, K.D. and Baumhueter, S., Biotechniques, 2000, 28:776-783
6. Applied Biosystems Protocol: ABI PRISM Dye Terminator /BigDye, Cycle sequencing Ready Reaction Kit with Amplitaq DNA Polymerase FS.
